Climate change is making the wettest days wetter, heightening flood risks.
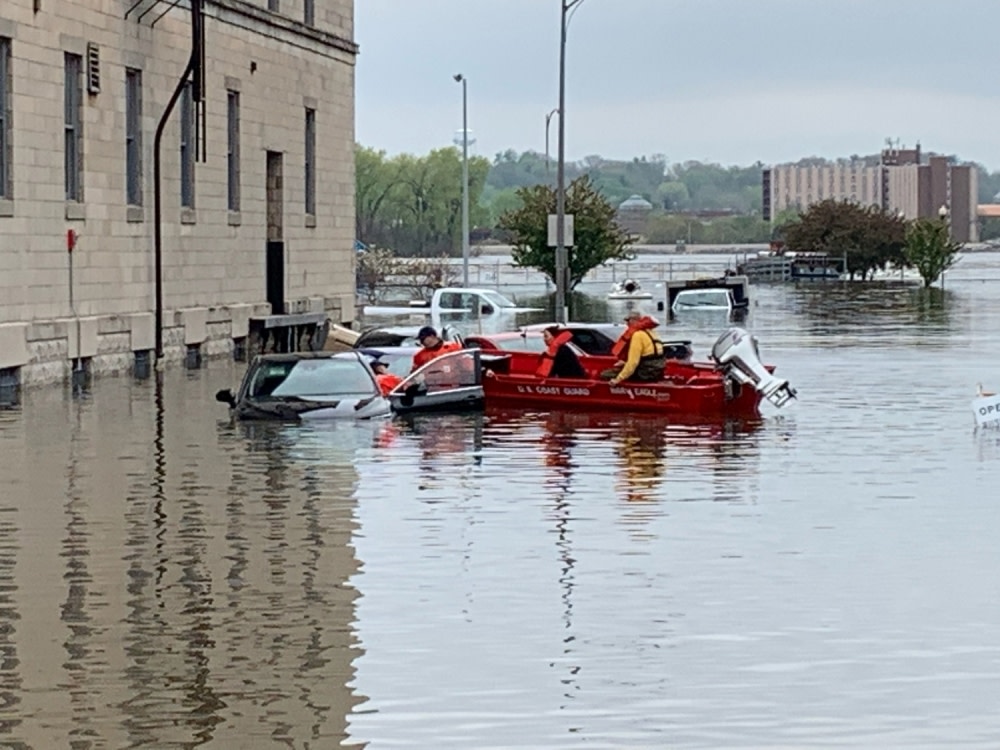
In the spring of 2019, floodwaters overwhelmed levees across the Midwest, drenching towns and causing billions of dollars in infrastructure and crop damage. Record downpours in Tennessee provoked a state of emergency and led to mudslides. In California, heavy precipitation damaged thousands of buildings. Extreme rain events have devastated communities around the nation — and the frequency and severity of such events are expected to worsen in a warming world.
Human-caused climate change intensifies the heaviest downpours. More than 70% of the planet’s surface is water, and as the world warms, more water evaporates from oceans, lakes, and soils. Every 1°F rise also allows the atmosphere to hold 4% more water vapor. So when weather patterns lead to heavy rain, there is even more moisture available for stronger downpours, increasing the risk and severity of flooding.
Floods often happen on the rainiest day of the year — the single calendar day with the most precipitation. Climate Central tracked how these wet days are trending over time, analyzing data for 244 cities around the country. In most areas, rainfall extremes have intensified as the climate has warmed.
The Wet Get Wetter
Since 1950, the wettest day of the year has gotten wetter in 79% of the cities analyzed. For 32 cities, that day’s extreme precipitation has increased by an inch or more, based on an analysis of the linear trend (detailed methodology below). Houston, Texas tops the list with an additional 2.78 inches of rain, followed by Greenville, North Carolina (2.44 inches), Hattiesburg, Mississippi (1.94 inches), and Baton Rouge, Louisiana (1.91 inches). All four are located in the Southeast, the wettest part of the nation, where cities average 50-70 inches of rainfall annually.
One can also examine the nationwide change in downpours by assessing each city’s percent change in precipitation on the wettest day of the year. This can provide a better comparison between cities that are traditionally wet or dry. Houston and Greenville are joined by Mankato, Minnesota; Lima, Ohio; and Jefferson City, Missouri as the five largest increases for the percentage change in these single-day events since 1950. Eleven of the top 20 cities are in the Midwest and Northeast. Even in areas with very little average annual rainfall, such as the Southwest, the analysis shows increased precipitation on the wettest day of the year.
In addition to getting stronger, extreme downpours are happening more frequently than in the past. In 80% of the cities analyzed, the top 1% of rain events have been recorded disproportionately recently. This recent swell is strongest in Clarksburg, West Virginia; Louisville, Kentucky; and Marquette, Michigan.
All-time records for rainfall have also surged recently. Nearly all the cities analyzed have data since 1950; 78% have data going back at least a century. If there were no trend in extreme rainfall, the all-time records would be evenly distributed across that century or more. However, 35% of cities have set their rainfall records since 1990. The most recent records in our analysis come from Hurricane Harvey, which dumped one-day totals of 16 inches in Houston and an astounding 26 inches in Beaumont, Texas.
Opening the Floodgates
As the climate warms, these stronger storms can intensify flooding. In the case of Hurricane Harvey, climate change made the record rain at least three times more likely and 15% more intense. California’s record rain in February came from an “atmospheric river” — a phenomenon that is also strengthened by climate change. And while other factors like ice jams and levee failures augmented the recent Midwest flooding, heavy rain has certainly contributed to it.
This spring’s floods have already brought several deaths and a multi-billion dollar price tag. Much of that cost comes from infrastructure damage, as thousands of homes and state highway miles have been affected. Another $1 billion corresponds to farming losses in America’s breadbasket, where corn planting has been delayed or even canceled for the season. Other floods have endangered public health, washing sewage into waterways and creating habitats for disease-carrying insects. According to a 2016 Climate Central report, heavy rain led to more than one billion gallons of sewage overflow in 2015-2016.
Finally, most cities have recently observed more storms with an inch of rain or more, causing threats of flooding to spike upward. The national frequency of 1”, 2”, and 3” storms has markedly increased since 1950.
Strengthening our flood defenses can reduce these impacts. The U.S. Climate Resilience Toolkit discusses resources and case studies, including climate preparedness workshops and hazard mitigation plans. For instance, Texas Medical Center in Houston has built its own energy supply on higher ground, while adding more permeable surfaces to manage stormwater. Still, climate change is outpacing adaptation. Only 8% of monitored levees in the U.S. are rated in “acceptable” condition, according to the American Society of Civil Engineers.
Curbing humanity’s greenhouse gas emissions would limit the increase in downpours. The U.S. government’s Climate Science Special Report provides a clear example. If greenhouse emissions continue unchecked, the frequency of a once-in-five-years rain event could increase two-to-threefold by late century. But if the world makes significant emissions cuts — roughly in line with the pledges from the Paris Agreement — the increase in frequency could be cut in half. In a waterlogged world, that difference would be critical.
Methodology
Using data from the Applied Climate Information System, Climate Central identified the calendar day each year with the highest precipitation for each station. Trendlines are based on a mathematical linear regression. Trends in one-, two-, and three-inch rainfall analyses are based on a methodology from Brian Brettschneider, a climate researcher at the University of Alaska Fairbanks.
Climate Central's analysis includes 244 stations. However, for data summaries based on linear trends, only 242 stations were included due to large data gaps in St. Johnsbury, Vermont and Wheeling, West Virginia.
